
In this post, you’ll learn how to break your PowerPoint charts apart to quickly generate stylish new looks for your data visualizations. This is an advanced PowerPoint technique, but the strategy behind it is simple. You use PowerPoint to graph your data for you (faster and more accurately than you could if you were to build it out yourself), and then you simply break out the pieces to creatively re-arrange them any way you like. Your creative process might look like this:
Step #1: Using the Rule of 2’s and Going Doughnut, you take the default pie chart pictured on the left, and turn it into the doughnut chart on the right.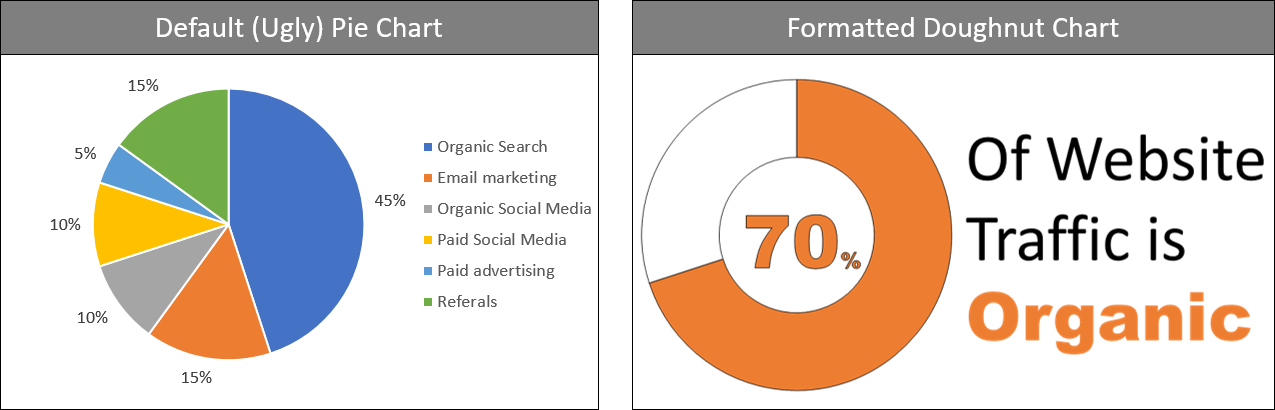
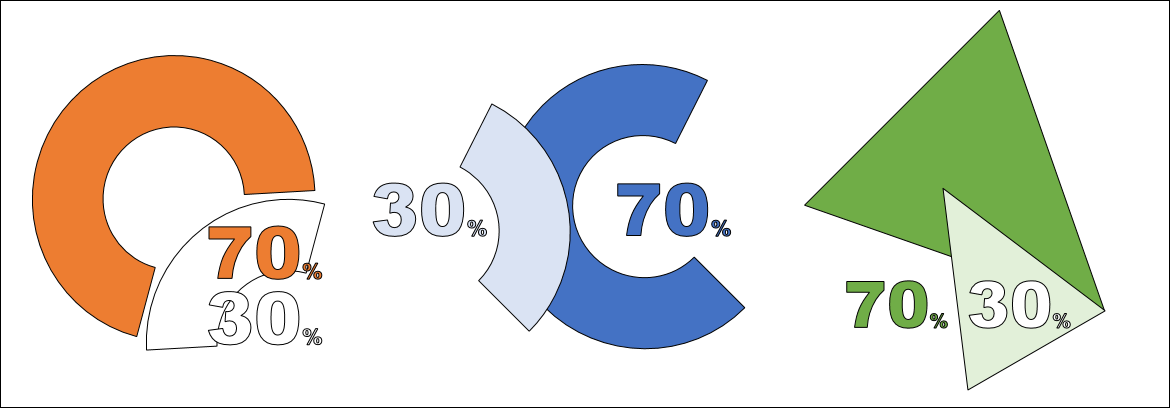
Step #2: To try something fresh and new, stack the pieces together in different ways.
To quickly pull off creative ideas like these for your charts, you simply need to break your charts apart. Follow the steps below but pay attention to the details. They make or break the trick (bad pun intended).
PowerPoint Shortcuts: If you need additional help with the PowerPoint shortcuts listed below, I’ve included hyperlinks to an epic post on PowerPoint shortcuts loaded with video explanations, pro-tips and more.
Step #1: Graph Your Data to Create the Pieces
Graph your data in PowerPoint as you normally would to create the pieces you need. This again is a great strategy you can use – getting PowerPoint to do the work for you – to get your pieces 10 times faster and more accurately than you could ever do manually.

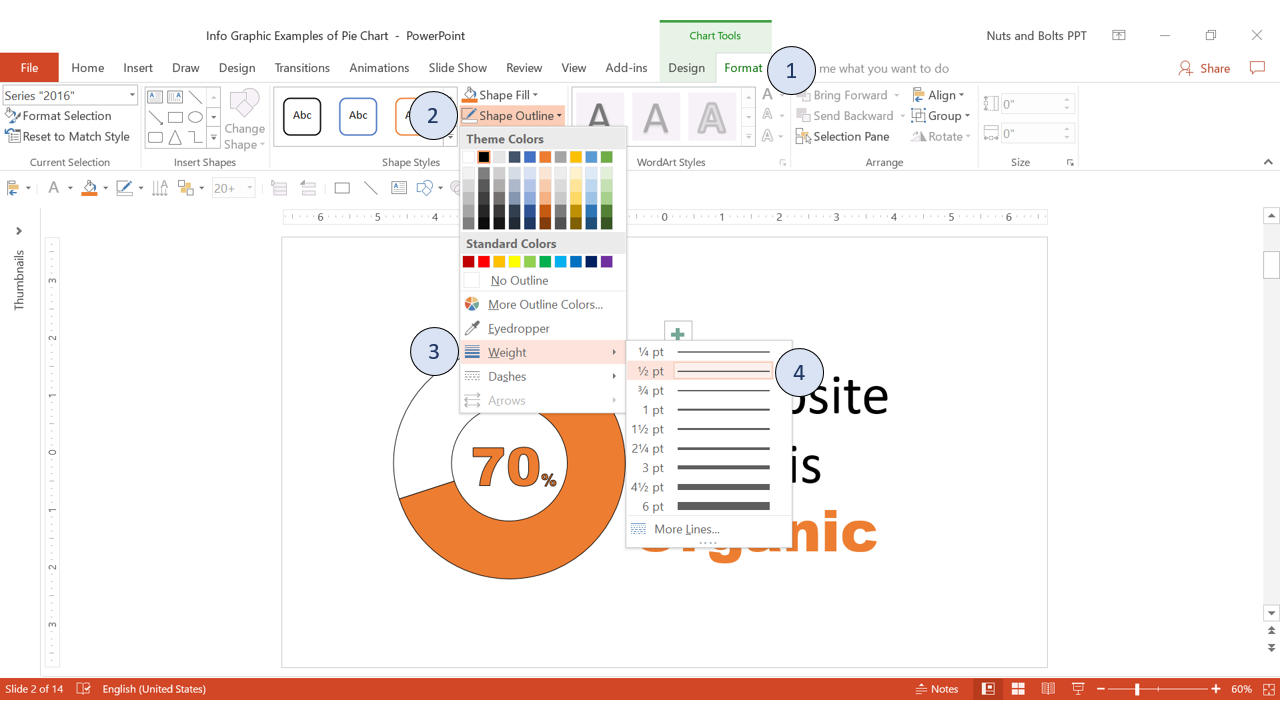
Step #2: Double-Check that You Have an Outline
- Select the pieces of whatever chart you are breaking and double-check that you have an outline on the shapes.
- Select your Chart and then open the Chart Tools Format tab
- Open the Shape Outline dialog box
- Open the Shape Outline Weight options
- Add a weight (doesn’t matter which one). It may seem like a silly thing to do, but this makes or breaks the trick.
Step #3: Cut or Copy Your Chart
Select your PowerPoint chart (with an outline) and either hit CTRL+X to Cut or CTRL+C to Copy on your keyboard. In the picture below I’ve cut the chart.

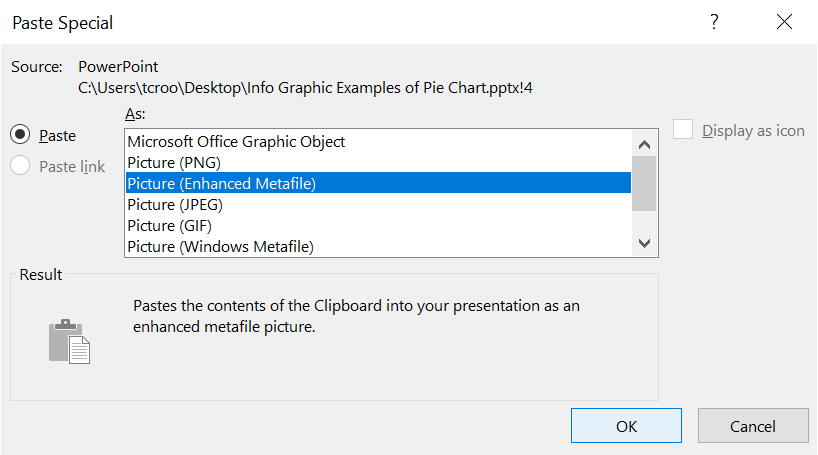
Step #4: Paste Your Chart as a Metafile
- Hit the Paste Special Shortcut (CTRL+ALT+V) to open the Paste Special dialog box.
- From the Paste Special dialog box options, choose either Picture (Enhanced Metafile) or the Picture (Windows Metafile) format, and then click Ok. That pastes a picture of your chart onto your slide (you can see that the Pictures Tools tab is now visible in your Ribbon).
Step #5: Ungroup Your Chart Twice
Select your Picture Metafile and use the ungrouping shortcut (CTRL+SHIFT+G) twice. Hitting CTRL+SHIFT+G once turns your chart into a group of fulling customizable shapes (just click Yes in the warning dialog box). 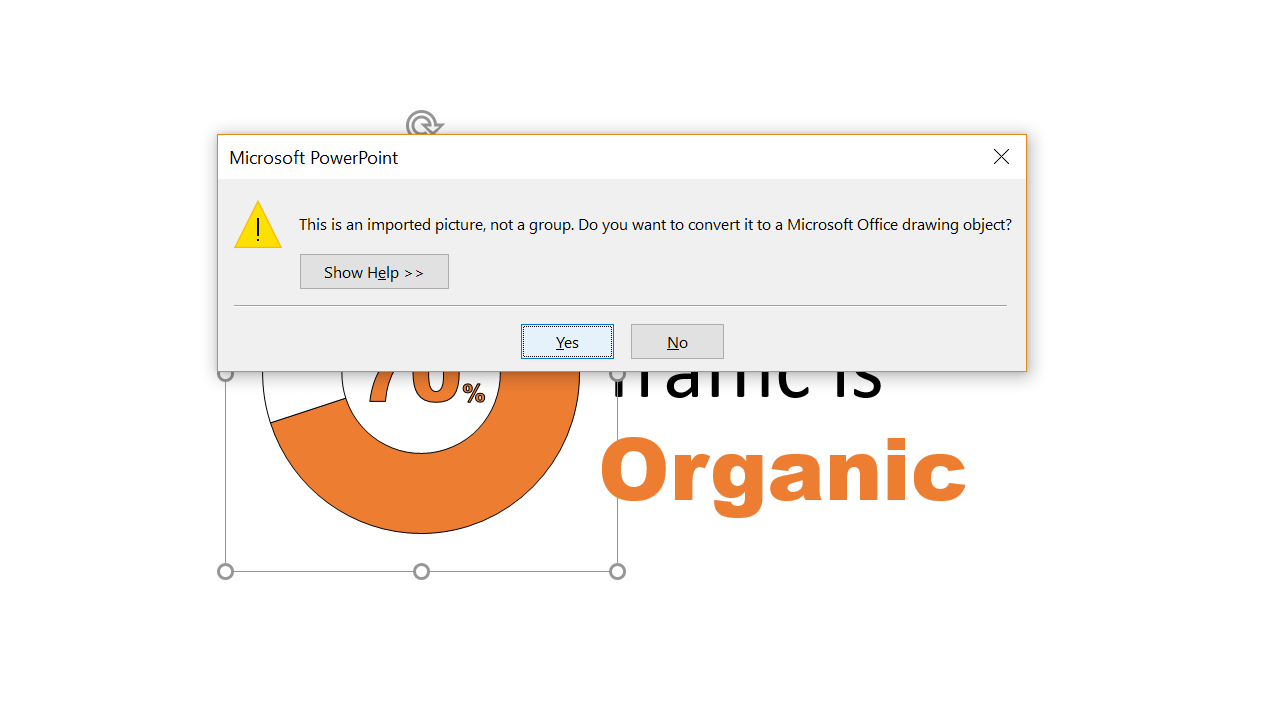 Hitting CTRL+SHIFT+G a second time breaks your group of shapes down into individual shapes that you can edit separately (you can see all the pieces in the graphic below).
From here you can pull them apart, format them and/or stack them any way you like.

PowerPoint 2016 Users: Depending on your chart, you might need to grab the outline pieces from your chart, and repeat the breaking process. Cut and paste as metafile and ungroup twice.
Step #6: Customize Your Visuals Any Way You Like
With your chart pieces broken out, you can then format and/or re-arrange them any way you like to create new and unique graphics for your presentations.
One important thing to keep in mind when breaking charts, broken charts remain permanently broken. There is no way to turn the broken pieces of your chart back into the original chart with the background Excel data. So before you get carried away, I recommend first saving a copy of your chart (with the background Excel data) that you can reference again in the future.
This is just one of many ways to get PowerPoint to do more work for you.
Taylor is the co-founder of Nuts & Bolts Speed Training, a PowerPoint speed training website that gets busy professionals to Happy Hour. Prior to Nuts & Bolts, Taylor lived and worked in China for 10 years in finance and consulting. When he’s not busy crafting PowerPoint training, you can find him traveling and scuba diving.


