There is an old saying, knowledge is power. In the learning industry that means collecting data on how our learners interact with our training. Through the proper collection and analysis of this information comes the power to identify learning gaps, design better learning experiences, and achieve training objectives in a more efficient and cost-effective way.
Yes, the extra effort in collecting learner metrics can result in changes that save money. For example, a company that was producing a lot of training videos began experimenting with animation videos. After analyzing employee preferences, comprehension, and retention rates, the company concluded that animations were just as effective as video production. The change saved them tens of thousands of dollars each year.
Data can be found everywhere, and when we consider the macro learning environment that encompasses learners, content, objectives, delivery platform, and HR systems, data collection can seem overwhelming. Traditional learning management systems provide very limited data.
In this article, I’ll focus on how to send detailed learner interaction data to Google Sheets.
From there it can be viewed, downloaded, and analyzed. Unlike sending xAPI statements to a Learning Record Store, Google Sheets is free and can be implemented immediately.
Send Course Data to Google Sheets
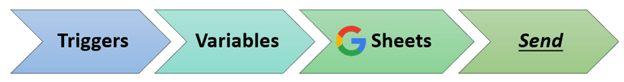
STEP 1 – Add Triggers
Let’s start with some basic concepts. To collect data, we need something to measure. In eLearning, that means we need to add interactivity to trigger the collection process. The ubiquitous next button can be used to generate data such as which pages were viewed and how long the user remained on the page. Notice how this one trigger of clicking on a next button can be used to create different data sets.
As we add more interactivity, we increase the types of data we can collect. Here are some examples of data that can be collected from different interactions.
|
INTERACTION |
DATA |
|
Click and Reveal |
Interest, Prior Knowledge, Course Design |
|
Knowledge Checks |
Comprehension, Learning Gaps |
|
Custom Interactions (Games) |
Engagement, Comprehension |
|
Rate This |
User Sentiment, Course Design |
|
Branching |
Learning Path, Prior Knowledge |
|
Pre-Testing |
Prior Knowledge |
|
Text Input |
User Generated Content |
As you can see, adding more interactivity enables you to collect more data. But what if the entire course was interactive? In an adaptive course, the user has options on how to view content on every page or slide in the course. For example, since learning styles are fluid, why not let the learner choose how to view the content (read, listen, watch, interact) on every page? There could be thousands of unique paths through the course. Tracking how learners access content can provide deep insights into your learners, the content, and course navigation that would not be possible any other way. Learn more about adaptive design on my blog https://learnerintelligence.org.
User-generated data can be collected when we use text fields to collect responses. For example, you can ask the learner to answer a question or leave a comment in a text field. One of my favorite uses is to have users apply what they just learned. In a sales training course, we asked users for their sales pitch. Some of the answers we got back were very funny. “Just buy it!”
STEP 2 – Use Variables
How does clicking on the next button collect data? Variables are used to store text or numerical data. Variables can save page names, how many times a user clicked, a sequence of clicks, and more. Text field responses are also stored in variables.
Challenge Question: What two variable types can Lectora send to an external destination such as an LMS? (See answer below.)
The data in these variables will be sent to
a Google sheet, but how do we do that?
Fortunately, Lectora makes this very easy. No coding is required with this simple trick. Since tests and surveys are already programmed to send answer variables, all we need to do is replace these variables with our variable values. I prefer to use a survey for this, leaving the test available for a course exam. The survey must have a question for each data variable you want to collect.
Setting Survey Variables
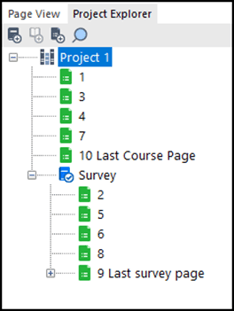
There are multiple ways to set the survey variables to your values. The navigation method uses a modified next button action to go to either a content page or a survey page. The Project Explorer shown to the left shows a ten-page course with pages numbered in the sequence followed. On each survey page use the automatically generated question variable (Question_0001) to store your data. When the survey is processed, all variable values are sent to the specified destination.
Another option is to create a series of actions that sets each question variable to your data variable. In a ten-page course with five variables, you will use five actions.
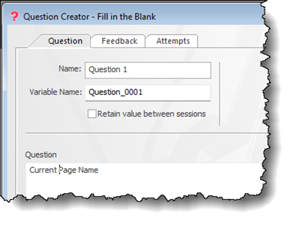
The survey must have a question for each data point you want to track. A Fill in the Blank question works well as it stores text or numbers. Take note of the variable name (see image).
Now let’s look at three data types you are likely to come across.
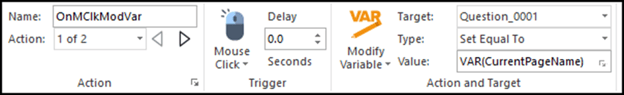
Reserved Variables are already in Lectora and must be saved in a survey variable. Here is an example of saving the page name when the next button is clicked. Add an action that sets the survey question variable equal to the page name variable as shown below.
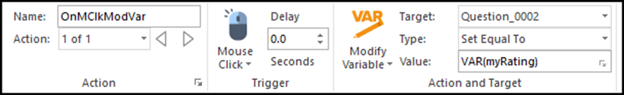
User-defined Variables are used to store any data you want to track. For example, if you want users to rate content Up or Down, add two buttons that set a myRating variable, then use the Modify Variable action to set the question variable to the rating value.
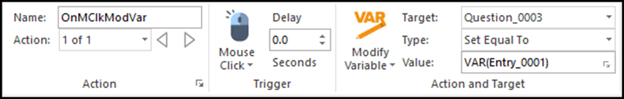
Text entry interactions work the same way. Text entry fields have variable names starting with Entry_ so you do not have to create a user-defined variable. As in the previous examples, use the Modify Variable action to set the question variable to the entry value.
STEP 3 – Create a Google Sheet
Now that all your data stored in survey variables, we need a Google sheet to store the data. Use one of the templates from this knowledgebase article Using Google Drive to Collect Results from Lectora to create the Google sheet.
STEP 4 - Send Data
Lectora makes it super easy to send variable data to Google. The option to connect to a Google Sheet is located under the Behavior & Results ribbon. Select the survey in the project explorer to see this ribbon.
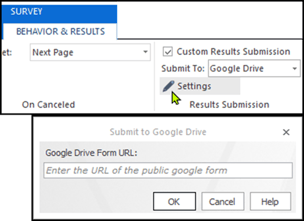
Select Custom Results Submission, then Submit To: Google Drive.
Select Settings and paste the URL for your Google Sheet.
When the survey is processed all the question variables are submitted to your Google sheet. You have full control of formatting and filtering the data as you would in any spreadsheet. If you want to share the sheet with your learners, you can embed it into your course as well.
In summary, learner metrics empower developers to make data-informed decisions in course design, enabling them to create more engaging, effective, and personalized learning experiences. By leveraging learner metrics, developers can create courses that meet learners' needs, enhance their understanding, and foster meaningful learning experiences.
Answer: The two variable types Lectora can send to an external destination are User-Defined variables and Reserved variables.